GET STARTED
Whether you're launching a single server e-commerce site, or you're a growing SaaS startup with new servers being deployed daily - we all have one thing in common. We need a reliable way to see the health of our servers at a glance and to receive notifications when something goes wrong.
In this article, we'll outline your options when it comes to server monitoring, and show you how to deploy your own server monitoring platform using Zabbix for those who want to go that route.
Server Monitoring Options
There are three main choices to consider when setting up a server or website uptime monitoring system for your business.
1, Use A Server Monitoring Service
There are a variety of services available that will monitor the health and connectivity of your servers and notify you via phone, email, or push notification in the event that the service is unable to reach your services. Some popular examples include:
- Uptime Doctor
- PagerDuty
- VictorOps
These services may be the right choice for you if you prefer to simply install a monitoring agent on each of your servers, and rely on another platform to manage the monitoring platform for a monthly fee. If you are looking for PagerDuty alternatives though, keep reading.
2, Purchase Server Management Monitoring
The second choice when considering the best server monitoring option for your needs is to purchase a server management plan which will monitor your servers and intervene in the event of an outage. This is the ideal choice if you do not have staff online 24x7, or you don't want to be woken up in the middle of the night during an outage.
Server management plans start at $39.99 per month and include 5 minute response times to any detected outage.
3, Setup Your Own Server Monitoring Platform
If you would prefer to manage server monitoring yourself without any additional monthly fees, you can also set up your own monitoring server (outside of your primary network, of course) which will monitor the uptime and health of all of your servers in one central location.
While this option takes more work, it allows you to maintain greater access and control of services accessing your server and also allows you to restrict monitoring access to only those inside of your private network.
What is Zabbix?
Zabbix is an open-source monitoring platform. The control panel software is installed on one server, and each server you want to monitor has a monitoring daemon installed. You can then visit your Zabbix control panel homepage and see the status of all servers at a glance as well as receive notifications in the event of an outage.
How much does Zabbix cost?
Zabbix is a totally free open-source software. You can use it on an unlimited number of servers without any licensing price. You will need a webserver to host the control panel, though.
Zabbix System Requirements
In order to run the Zabbix control panel, you will need a Linux server with a recommended 2 CPU cores and 2GB of memory for a medium-sized monitoring example. The server will need database software such as MySQL and Apache with PHP 5.4 or greater.
What You'll Need
- A Cloud or Dedicated Server will be used to run the monitoring software
- The latest version of Debian, although Zabbix will run on any version of Linux
How to Install Zabbix
We're now going to walk you through how to install Zabbix, an open-source monitoring software on a Linux Hybrid or Dedicated Server. Zabbix is fully free to use on an unlimited number of hosts and has been a trusted software platform for many years in the hosting industry.
Step 1: Connect to SSH on the Monitoring Server
Start by connecting to SSH on the server you wish to host the monitoring software on:

Step 2: Download the Zabbix Installation Files
Next, we'll download the required repositories:
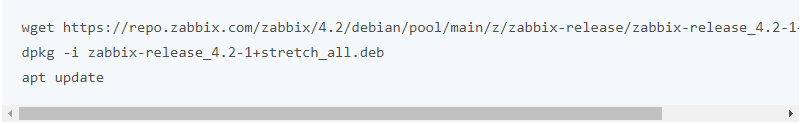
Step 2: Install Zabbix Server
We can now install the Zabbix Server and Zabbix Frontend, which includes MySQL:

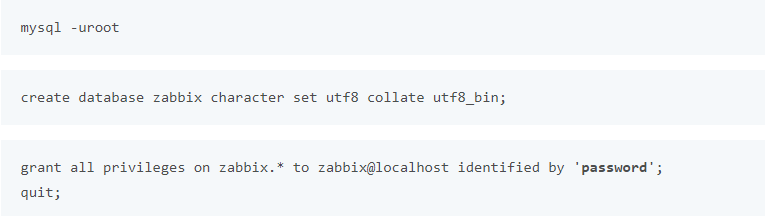
Step 3: Create the MySQL Database
Zabbix needs a MySQL database to operate, so we can create it now:
Step 4: Import MySQL Data
We can now import the required database data into our newly created database:

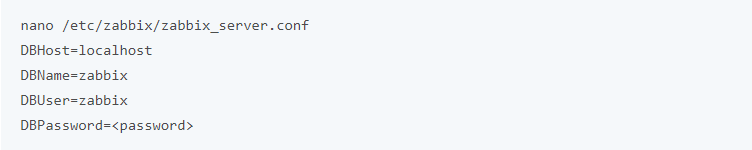
Step 5: Update Database Information
Update the Zabbix Server configuration file with the database password which you previously set:
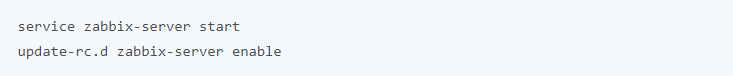
Step 5: Start the Server
The monitoring server can now be started, and we'll set it to run at startup as well:
Step 6: Set Timezone and Restart Apache
Finally, we'll need to set our timezone in the Zabbix configuration file:

Save the file and restart Apache:

Installing the Front End of Zabbix
Step 1: Visit the admin interface in your browser
Visit http://server-IP/zabbix in your browser.
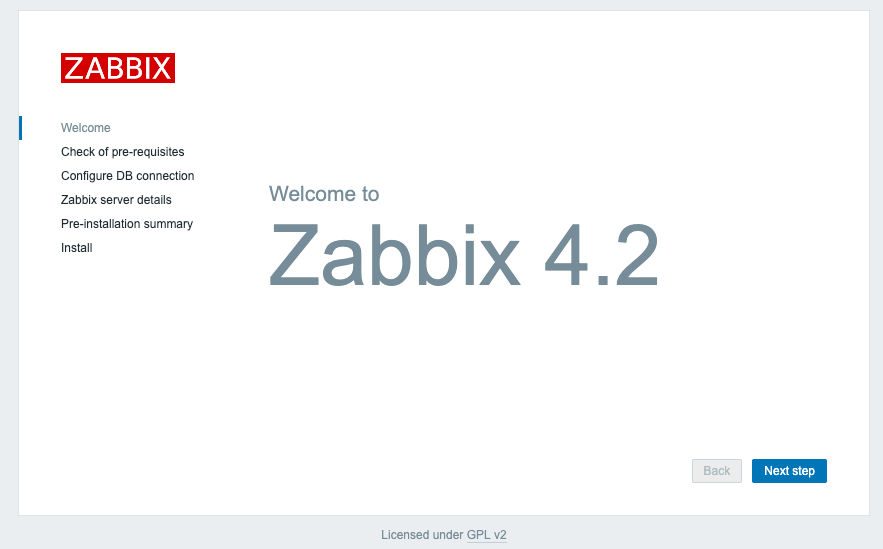
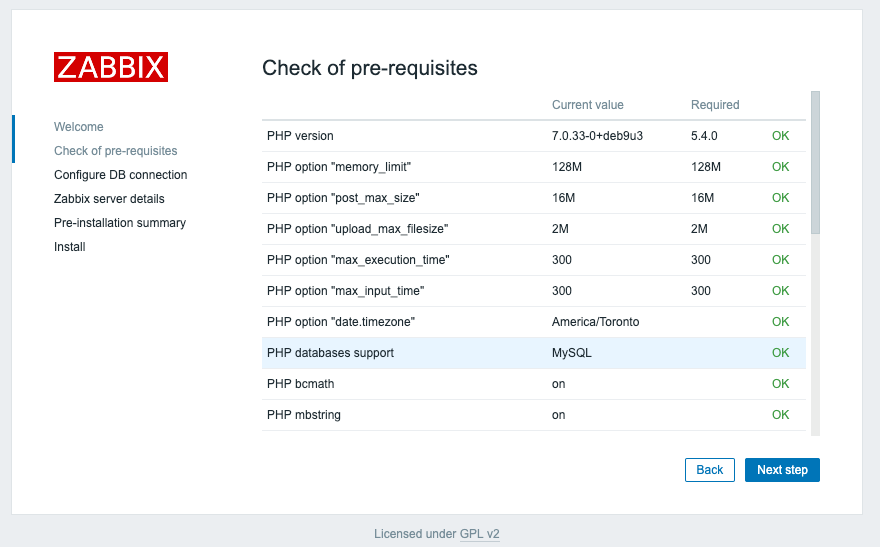
Click Next Step if all pre-requisites are met.
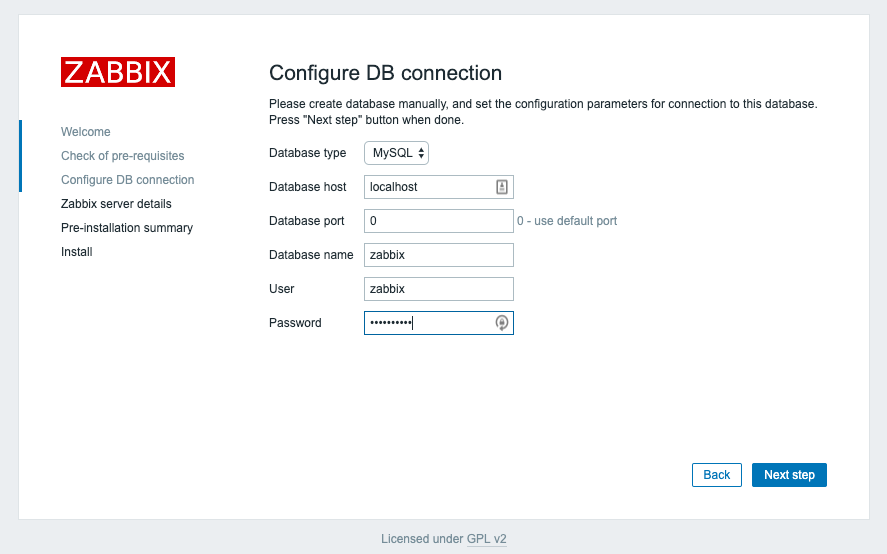
Enter the database information and click Next Step.
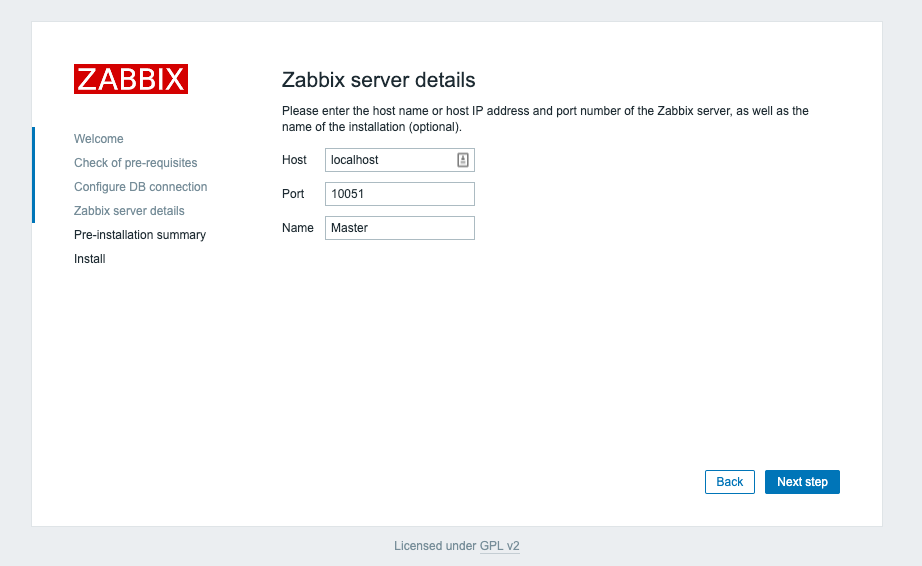
Click Next Step.
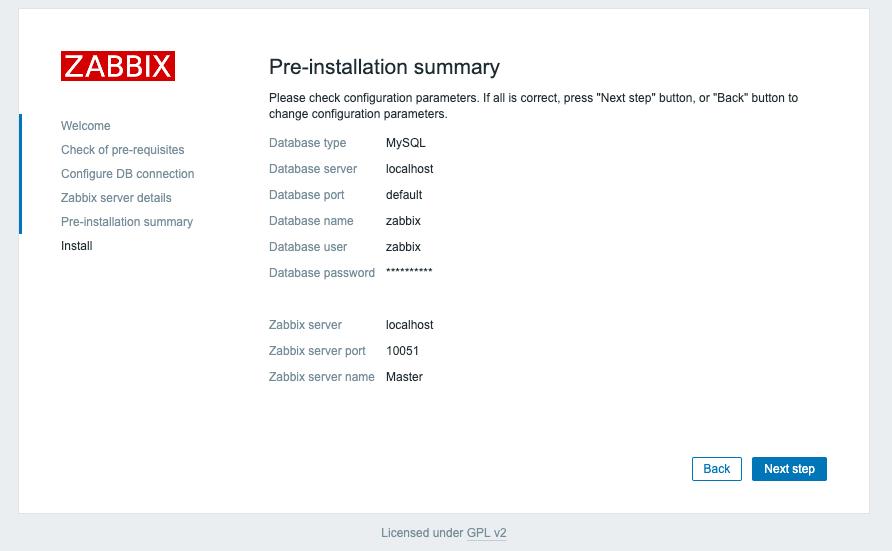
Confirm all details and click Next Step:
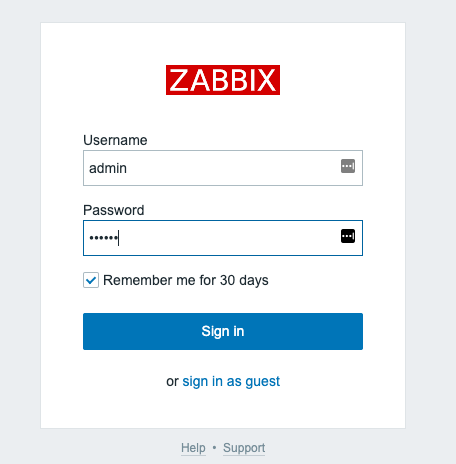
You may now log in with the username Admin and password Zabbix. This information is case-sensitive. Ensure to change the login credentials once logged in.
Installing the Zabbix Monitoring Agent
We can now install the monitoring agent on each server we wish to monitor.
Step 1: Login via SSH to the Server

Step 2: Install the Zabbix Agent

Step 3: Update the Configuration File
We'll edit our Zabbix Agent configuration file with the IP address of our master monitoring server:

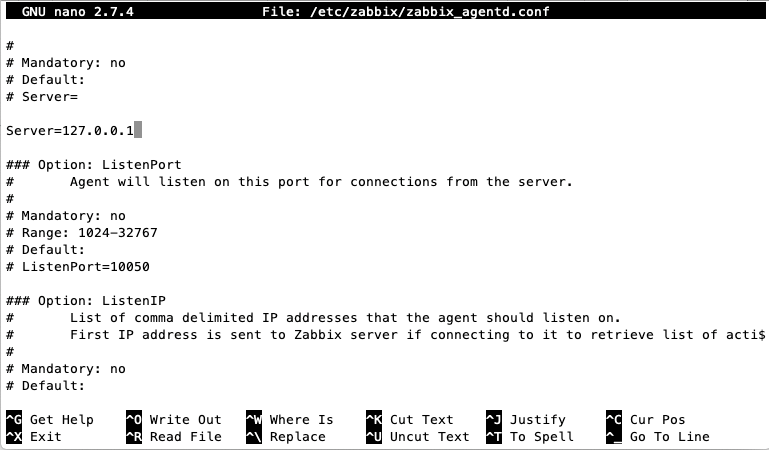
Set the option for server to be the IP address of your monitoring server. Replace 127.0.0.01 with your monitoring server IP.

Save and close the FIle
Step 4: Start the Agent

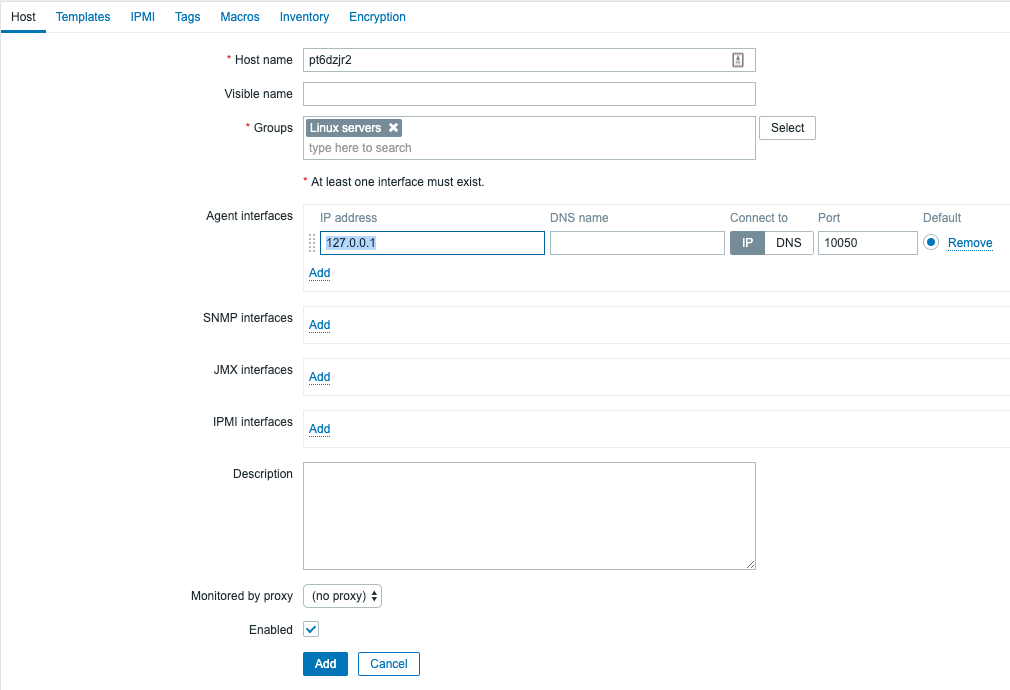
Step 5: Add the New Host into Zabbix
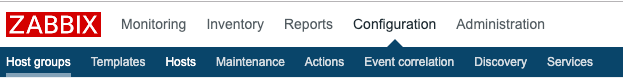
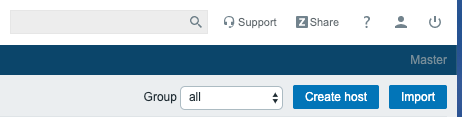
In the Zabbix administration panel, click on Configuration > Hosts
Click Create Host in the top right-hand corner:
Enter the server hostname, IP address, and choose a host group to monitor the server in.
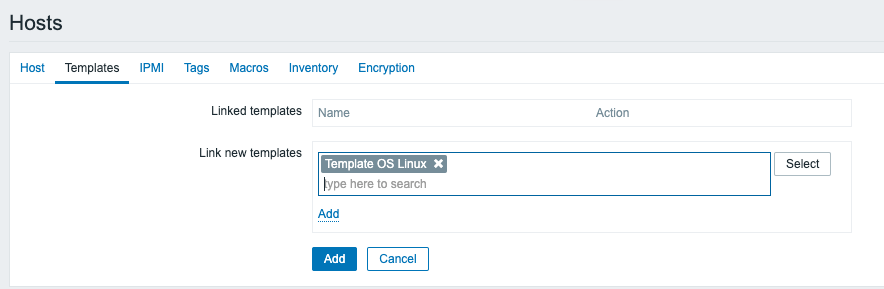
In the Templates tab, choose Linux OS Template and click Add
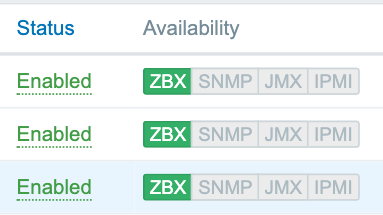
Click the blue Add button to add the host. The host will appear as ZBX available in a few minutes if the process was completed properly:
Configuring Server Monitoring Notifications
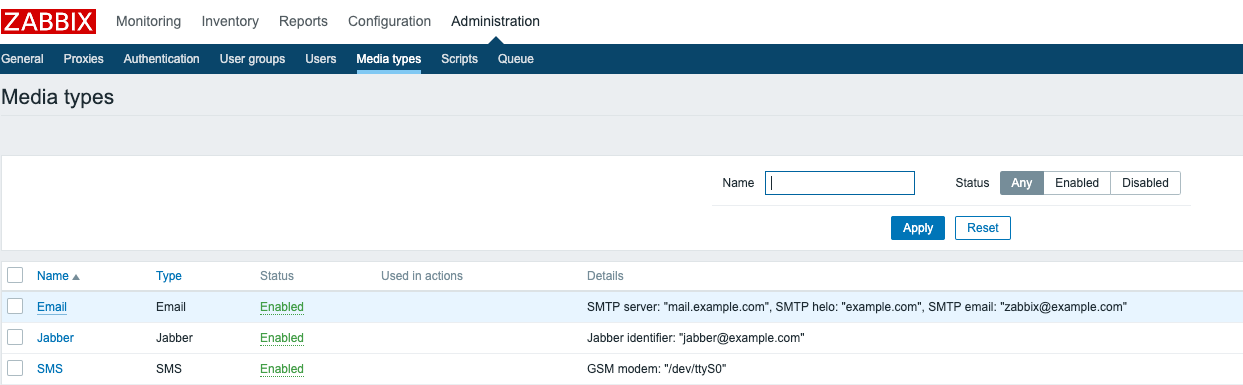
Begin by setting up the mail server settings in Administration > Media Types:

This page will allow you to configure the mail server settings of your pre-existing mail server that will send notifications:
Once the mail server settings have been updated and tested, you can configure email on the relevant users.
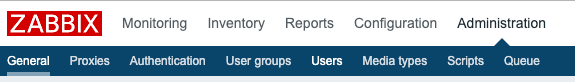
To configure email notifications, click on Administration > Users
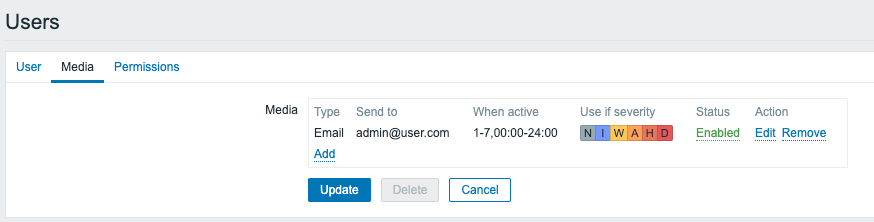
Choose the user you wish to edit, and under the Media tab, you can enter an email and outline which alerts to send email notifications about.
SMS
There are some Github projects created which allow you to integrate with an SMS provider like Twilio to send SMS notifications in the event of a server outage.
Setting Up Monitoring Screens
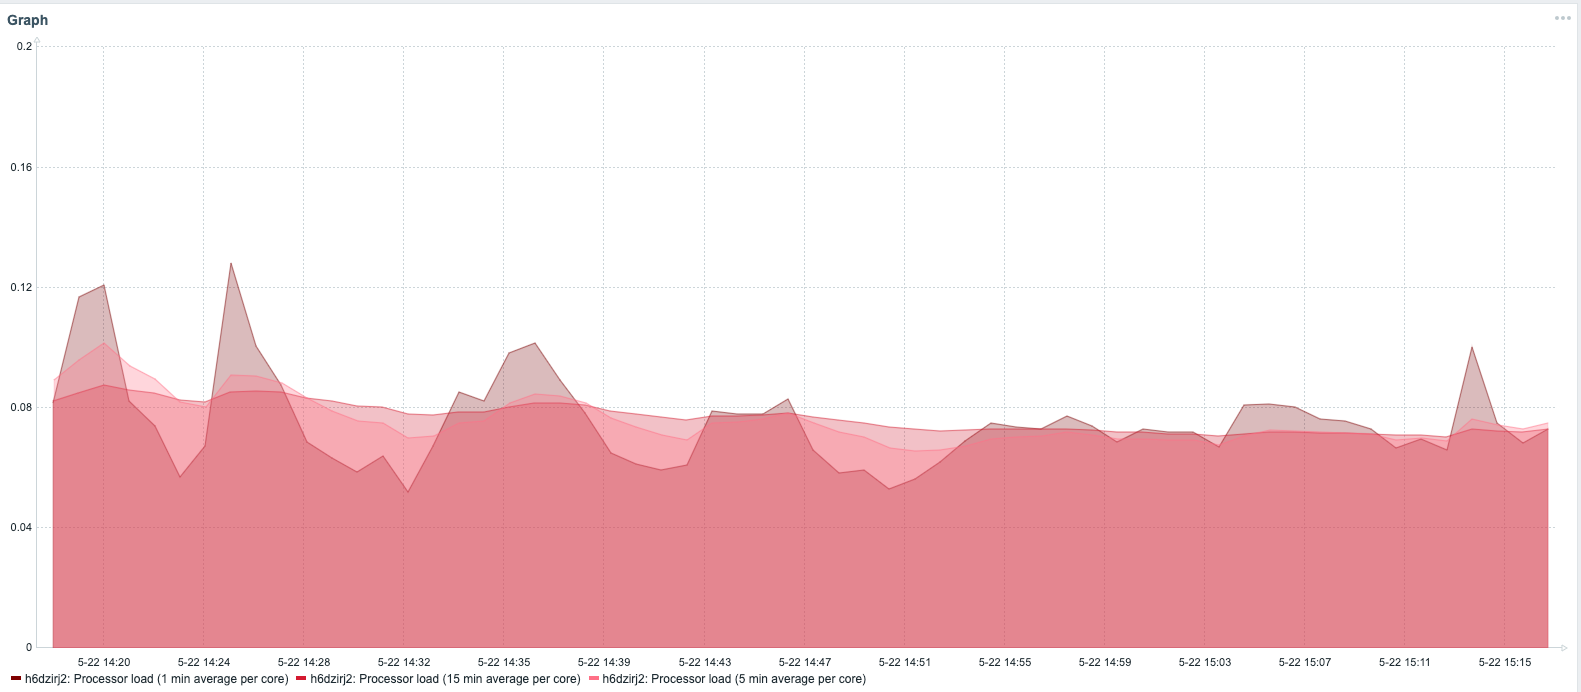
Zabbix has a variety of fully customizable dashboards, screens, and graphs that can be used to have a glance view of your entire server fleet's health. We recommend spending some time setting up these screens based on your particular needs.
Next Steps
You now have a fully configured Zabbix monitoring center where you can see complete server information about your entire server fleet as well as receive notifications about any issues that may arise.
